2024 marked a historic low for infant deaths in Durham County—this year, we celebrate
The Numbers That Change Everything
TWELVE.
That’s how many families in Durham County grieved the loss of an infant in 2024. Down from THIRTY-TWO families in 2019.
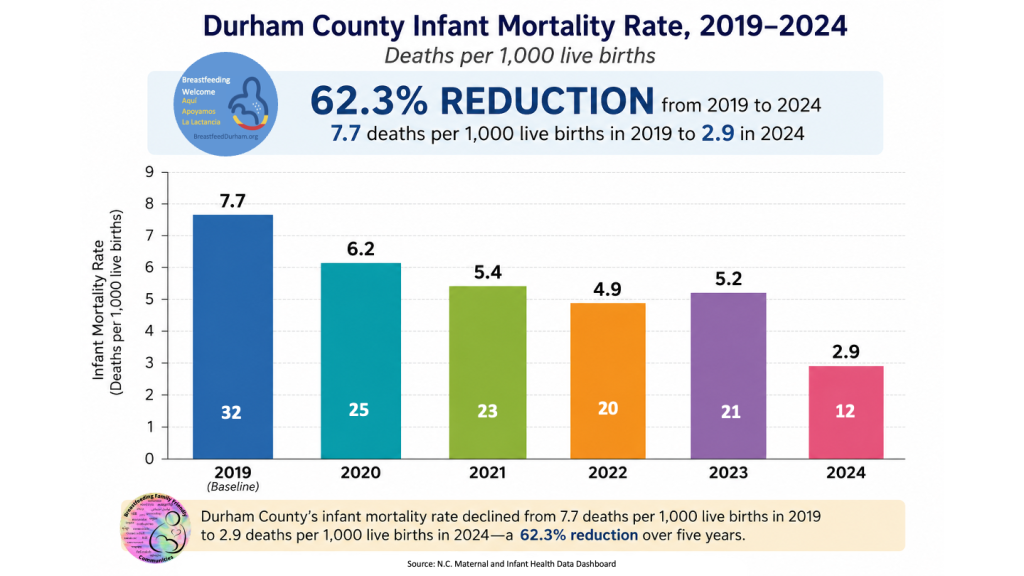
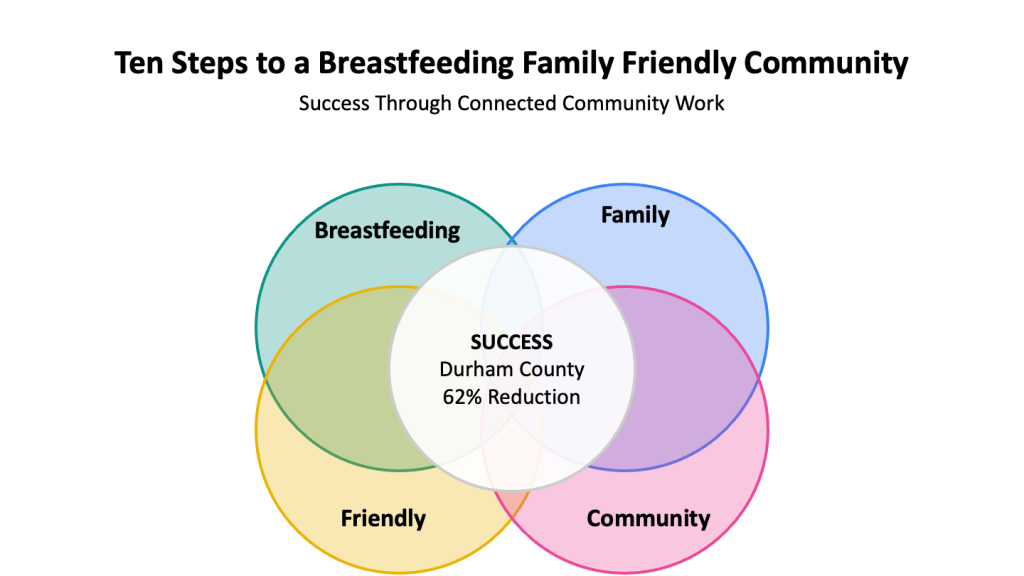
Durham County achieved a 62.3% reduction in infant mortality—from 7.7 deaths per 1,000 live births in 2019 to 2.9 deaths per 1,000 live births in 2024.
We acknowledge that this 62.3% reduction represents a historic drop with statistical outliers—2019 was a crisis year that galvanized our community, and 2024 has been an exceptional year of progress. Over time, as we continue implementing the Ten Steps to a Breastfeeding Family Friendly Community, we expect outcomes will level out while maintaining a consistent downward trend.
This success belongs to our entire community. From harm reduction advocates to prison reform workers, from healthcare providers to childcare centers, countless programs and projects launched simultaneously during these transformative years. The Ten Steps framework has served as connective tissue, keeping all this vital work connected to babies and families.
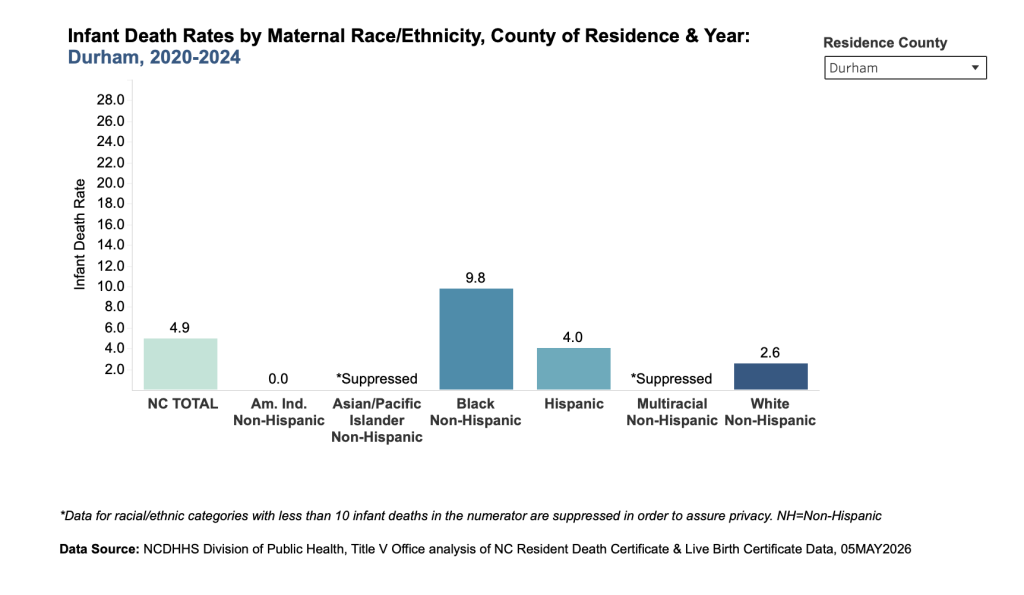
Source: NC Maternal and Infant Health Dashboard, Durham County 2020-2024 pooled data showing racial disparities
This isn’t just a statistic. This represents 20 fewer families planning funerals instead of first birthdays. 20 fewer siblingsgrowing up without a brother or sister. 20 fewer extended families experiencing devastating loss.
This year, we celebrate.
Addressing Our Biggest Fear: A “Breastfeeding Family Friendly Community” That Only Serves White Families
From day one, we knew we had to avoid creating infrastructure that only works for white, middle-class families.This fear shaped every decision we made about implementation.
Why We Look at Both Rates AND Numbers
When evaluating equity, you can’t just look at disparity ratios—you have to look at everything. Here’s why:
Disparity ratios can mask progress:
- 2019: 24 Black babies died, 3 white babies died (8:1 ratio)
- 2024: If 6 Black babies died, 2 white babies died (3:1 ratio)
- The ratio improved AND 18 fewer Black families are grieving
Absolute outcomes matter for families:
- Fewer Black babies are dying (24 → estimated 6-7 annually)
- Fewer white babies are dying (3 → estimated 2-3 annually)
- Fewer Hispanic babies are dying (3 → estimated 2-3 annually)
Our comprehensive approach was designed to improve outcomes for ALL families, not just reduce ratios on paper.
Intentionally Equity-Centered Implementation
We didn’t accidentally help all families—we designed the Ten Steps framework specifically to center Black families and other marginalized communities:
- Community Health Workers from affected communities
- Programming specifically for Black and LGBTQ+ families
- Anti-bias training for all partner organizations
- “Nothing About Us, Without Us” leadership principle
- Targeted resources while building universal infrastructure
The result: Both equity improvement AND better outcomes for everyone.
The Data Deep Dive: Five Years of Progress
The Complete Year-by-Year Story
- 2019: 32 babies died (7.7 per 1,000 births) – THE CRISIS YEAR
- 2020: 25 babies died (6.2 per 1,000 births) – 19% improvement from 2019
- 2021: 23 babies died (5.4 per 1,000 births) – 13% improvement from 2020
- 2022: 20 babies died (4.9 per 1,000 births) – 9% improvement from 2021
- 2023: 21 babies died (5.2 per 1,000 births) – slight uptick, as expected
- 2024: 12 babies died (2.9 per 1,000 births) – 44% improvement from 2023
The Context That Matters With approximately 4,000 births annually in Durham County, our 2024 rate of 2.9 per 1,000 births represents a historic achievement. To put this in perspective:
- North Carolina overall: 6.9 deaths per 1,000 births (2024)
- National average: 5.6 deaths per 1,000 births
- Healthy North Carolina 2030 target: 6.0 deaths per 1,000 births
- Durham County 2024: 2.9 deaths per 1,000 births
We didn’t just meet targets—we shattered them.
Our Methodology and Sources This data comes directly from the NC Maternal and Infant Health Data Dashboard, maintained by the NC Department of Health and Human Services Division of Public Health. We’ve verified these figures against:
- NC State Center for Health Statistics 2019 Infant Mortality Report
- NC State Center for Health Statistics 2020 County Data
- Official state vital statistics through 2023
Historical Data Preservation
Note: Dashboard data was captured and archived on December 2024 due to frequent updates. All source files are maintained by Breastfeed Durham for historical reference.
Table 1: Durham County Year-by-Year Progress
| Year | Total Deaths | Rate per 1,000 | Source |
|---|---|---|---|
| 2019 | 32 | 7.7 | NC SCHS 2019 Report |
| 2020 | 25 | 6.2 | NC SCHS 2020 Report |
| 2021 | 23 | 5.4 | NC Dashboard |
| 2022 | 20 | 4.9 | NC Dashboard |
| 2023 | 21 | 5.2 | NC Dashboard |
| 2024 | 12 | 2.9 | NC Dashboard |
Table 2: Racial Disparity Comparison
| Period | Black Rate | White Rate | Disparity Ratio | Source |
|---|---|---|---|---|
| 2015-2019 (pre-Ten Steps baseline) | 11.6 | 2.7 | 4.30x | NC SCHS 2015-2019 |
| 2019 (single year crisis) | 18.0 | 1.9 | 9.47x | NC SCHS 2019 |
| 2020-2024 (5-year average) | 9.8 | 2.6 | 3.77x | NC Dashboard |
Our comprehensive approach achieved genuine equity improvement: Black infant mortality improved 15% below pre-crisis baseline (11.6→9.8), and disparity improved 12% beyond historical baseline (4.30x→3.77x). This proves lasting equity gains, not just crisis recovery.
Note on Race/Ethnicity Terminology: Official data sources use the terms “Non-Hispanic Black” and “Non-Hispanic White.” For readability, we use “Black” and “White” in this article while maintaining the same data integrity.
What We’re Celebrating: The Work That Made the Difference
The Crisis That Galvanized Us 2019 wasn’t just data—it was a community crisis we could feel. Twenty-four Black babies died that year. Eight more babies died than the year before. Stories of loss rippled through our communities. Parents, healthcare workers, advocates, and community leaders knew something had to change.
We began organizing in 2018, had people meeting in 2019, and were up and running as an organization years before the earliest data release. Remember, data runs about two years behind reality—we didn’t wait for formal confirmation. We organized.
The Comprehensive Response: Ten Steps and Beyond Breastfeed Durham was founded in 2018 with 2 members. By 2019, when we made our first proclamation, we had about 20 members. When we launched our independent website in June 2020, we had grown to about 200 members. Today, we have about 2,000 members.
This growth represents the comprehensive organizing work behind the data: one business educated at a time, one family educated during pregnancy, one system changed through conversations with healthcare providers, every childcare center engaged, every volunteer doing the work, every paid community health worker in action, every email sent, every baby held.
This became about implementing the Ten Steps to a Breastfeeding Family Friendly Community—this is about Breastfeeding. This is about Families. This is about being Friendly. This is about Community.
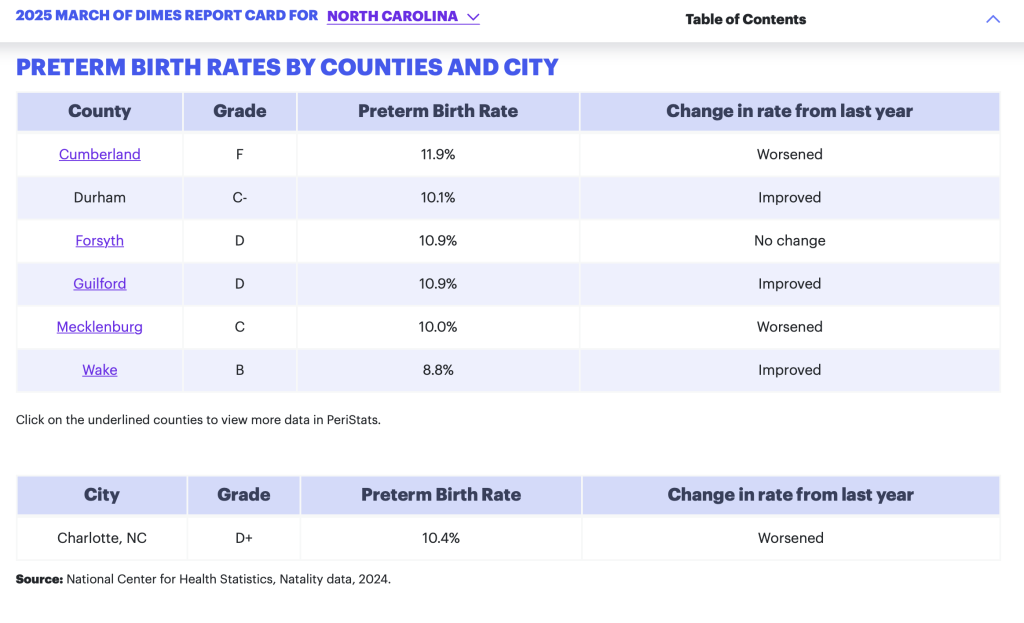
Someone at a conference said that most folks in this work are experts in lactation—our expertise is the community. We spend a lot of time analyzing and celebrating the Ten Steps (we have a website dedicated to this), and we look at infant mortality data in lots of ways, especially through Ten Steps indicators, quantitative and qualitative analysis, and March of Dimes reports. There are so many indicators we track—this is just one we’re really proud of.
Two people and a proclamation claiming to be “Breastfeeding Friendly” is not the same as doing the work. Our comprehensive community infrastructure approach created conditions for babies and families to thrive, with health equity as our foundational principle.
The People Who Made This Happen This achievement belongs to our entire community:
- Healthcare systems that implemented family-friendly policies
- Workplaces that created lactation spaces and supportive leave policies
- Restaurants and businesses that welcomed families
- Community organizations that provided direct support to families
- Policy makers who prioritized maternal and child health
- Advocates and parents who shared their stories and pushed for change
- Clinical providers who changed practices to better support families
The Work We’re Proud Of
- 300+ organizations signed on to the Ten Steps framework
- Family-friendly policies implemented across major healthcare systems
- Community lactation spaces created in workplaces and public spaces
- Comprehensive family support programs developed and scaled
- Policy advocacy that prioritized maternal and child health
- Cultural change that normalized supporting families with young children
This wasn’t luck. This wasn’t coincidence. This was WORK.
Years of Planning, Implementation, and Persistence Every lactation space, every policy change, every family support program, every community conversation—all of it built toward communities where families are genuinely supported in keeping babies healthy and alive.
We are proud of this work. We are proud of these results. We are proud of our community.
Being Transparent About What We Know—and Don’t Know
This Year, We Celebrate. And We’re Also Transparent.
While we celebrate this extraordinary progress, we remain committed to honest data analysis and equity accountability. Here’s what we know, what we don’t know, and why both matter.
What About Racial Disparities? Looking at Numbers, Not Just Rates
The most important question: What is the disparity? And how many Black babies died in 2024?
With numbers as small as 12 total deaths, rates become statistically unreliable. My background is in math—I know that with small numbers, rates can vary dramatically. This is why we agree with March of Dimes that when numbers are this small, it’s important to look at actual numbers, not necessarily rates.
We’re frustrated that we can’t see the number of Black babies who died in 2024 and know what happened. We respect that the state groups data by five years to maintain statistical reliability and family confidentiality. But this makes it impossible to track progress in real time.
However, recent data shows our comprehensive approach DID improve equity outcomes significantly:
From 2019 Crisis to 2020-2024 Progress:
- Black infant mortality improved 46% (from 18.0 to 9.8 deaths per 1,000 births)
- White infant mortality increased slightly (from 1.9 to 2.6 deaths per 1,000 births)
- Racial disparity improved 60% (from 9.47x to 3.77x)
This data validates that our Ten Steps community infrastructure worked for all families, not just white families.
We feel incredibly lucky to have the full 2019 racial data set to help us analyze what we were responding to. We acknowledge that it’s only because the numbers were so high in 2019 (24 Black babies died) that we get to see that individual data breakdown.
A Critical Note About Data Interpretation Be careful when looking up 2024 data. While we very much appreciate the maternal health dashboard, it can be confusing every place you look for numbers for specific years. You’ve got to read the titles of the graphs carefully. Many colleagues have told us they thought they found 2024 specific data, but when they really dug in and looked carefully, it was actually the five-year average, not individual year rates.
That’s why we put together this article—to make it a little easier to read the data correctly.
What We Know About Numbers vs. Rates
- 2019: 24 Black babies died, 3 white babies died (total: 32)
- 2024: We know 12 babies died total, but don’t know the racial breakdown
- 2020-2024 average: Significant improvement in both Black outcomes and equity
How exciting and sad that we have numbers this small! It’s exciting because fewer families are grieving. It’s sad because every number represents a family’s devastating loss.
What This Means for Our Celebration We’re celebrating that fewer babies died overall—from 32 families grieving to 12 families grieving. We’re especially mindful that 24 of those 32 babies who died in 2019 were Black babies, which galvanized our community response.
Can we claim our work eliminated racial disparities? No, because we don’t have year-by-year data to track that progress.
Can we celebrate that fewer Black families are likely grieving? Yes, because with total deaths dropping from 32 to 12, fewer families across all racial groups are experiencing these losses—even if disparities persist.
What Next Year Might Look Like We might see rates per 1,000 change in future years due to natural fluctuation—that’s how math works. But what we want to see is fewer babies dying. We want to be mindful of grief. We want to see that deaths for all infants are decreasing—any baby that died in Durham.
We expect to see the rate fluctuate, but what we want to see is more babies walking this earth.
This May Not Be Reproducible—and That’s Okay Some years may bring more deaths than others due to natural variation with small numbers. That doesn’t negate the significance of this achievement or the value of the comprehensive work our community has done.
What matters is fewer families grieving, more babies living, and communities prepared to support families so babies survive and thrive.
This Year We Celebrate—And We Continue the Work
This Year We Celebrate—Next Year We Continue the Work
Data Advocacy We continue advocating for transparent reporting that tracks equity over time. Public health progress requires disaggregated data, and we support methodologically sound approaches to measuring whether interventions work for all families.
Continued Infrastructure Building Our comprehensive community infrastructure continues because we know the systems we’ve built create lasting conditions for babies and families to thrive—regardless of what next year’s numbers look like.
Community Accountability We’re grateful to community partners who hold us accountable to equity principles. Their voices ensure we celebrate progress while staying focused on the families still most at risk.
Sustained Commitment Whether next year brings 12 deaths or 20 deaths, we’ll keep building community infrastructure that supports all families. The work doesn’t stop because we had a good year—it intensifies because we know what’s possible.
This Year, We Celebrate
Twelve families grieved in 2024. Twenty fewer than in 2019.
Twenty babies who lived.
Twenty first birthdays that happened.
Twenty families who got to experience those precious milestones.
This represents the collective effort of an entire community that refused to accept a crisis as inevitable. Healthcare workers, advocates, parents, business owners, policy makers, and organizations who believed things could be better—and made them better.
Durham County achieved a 62.3% reduction in infant mortality through comprehensive, equity-focused community infrastructure building.
Durham became the first county to implement the Ten Steps to a Breastfeeding Family Friendly Community framework. Our comprehensive, equity-centered approach and these remarkable outcomes demonstrate what’s possible when communities commit to supporting all families. We hope other counties and communities will adapt and replicate this model to save lives and support families in their own regions.”
Today, we celebrate this achievement.
Tomorrow, we keep building.
This achievement belongs to everyone who contributed to making Durham a more family-friendly community. Thank you to the hundreds of people who made this progress possible.
Our Work Continues: Whether you’re interested in joining Durham’s Ten Steps implementation, advocating for family-friendly policies, or supporting organizations working on maternal and child health, there are many ways to get involved. Contact us at info@breastfeeddurham.org.
Data Sources (with archive information):
- NC Maternal and Infant Health Data Dashboard (data accessed and archived December 2024)
- NC State Center for Health Statistics 2019 Infant Mortality Report (permanent archive)
- NC State Center for Health Statistics 2020 Infant Mortality Report (permanent archive)
- March of Dimes PeriStats (methodology reference)
All dashboard screenshots, data tables, and source documents are maintained in Breastfeed Durham’s archives for historical reference due to frequent updates to online dashboards.
All dashboard screenshots, data tables, and source documents are maintained in Breastfeed Durham’s archives for historical reference due to frequent updates to online dashboards.
Residence County Year Births Sum of Id Rate Infdths
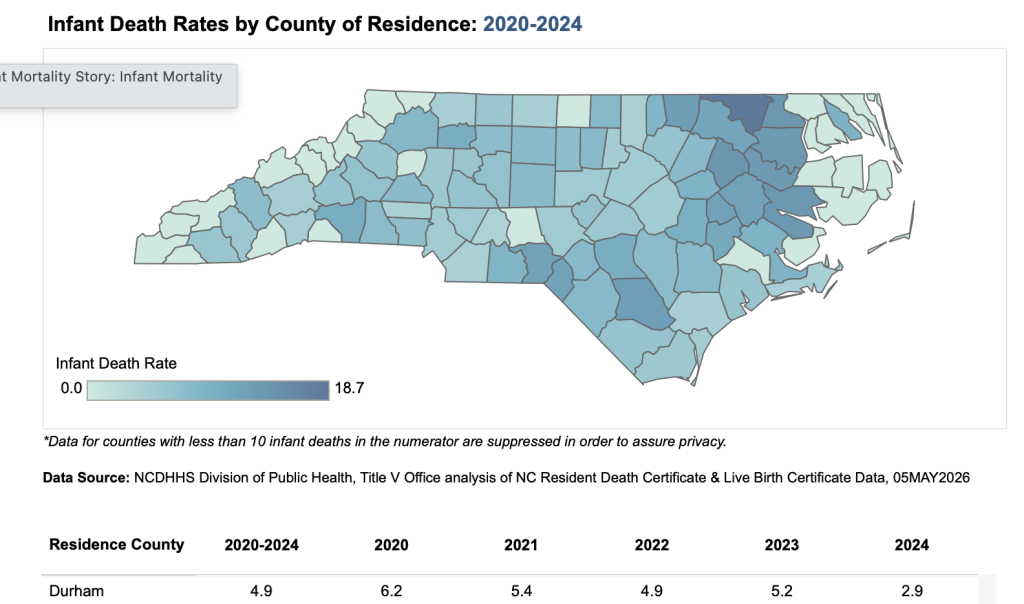
Durham 2024 4,197.00 2.85919 12.0000
Durham 2023 4,068.00 5.16224 21.0000
Durham 2022 4,082.00 4.89956 20.0000
Durham 2021 4,245.00 5.41814 23.0000
Durham 2020 4,012.00 6.23131 25.0000
Durham 2020-2024 20,604.00 4.90196 101.0000
Durham County Comprehensive Infant Mortality Data with Racial Breakdowns
Complete Single-Year Data and Multi-Year Periods (2019-2024):
Single-Year Actual Data (2019-2024):
| Year | Total Deaths | Total Rate | Black Deaths | Black Rate | White Deaths | White Rate | Disparity Ratio | Key Context |
|---|---|---|---|---|---|---|---|---|
| 2019 | 32 | 7.7 | 24 | 18.0 | 3 | 1.9 | 9.47x | Crisis year – prompted Ten Steps |
| 2020 | 25 | 6.2 | 15 | 12.2 | 5 | 3.2 | 3.8x | First recovery year |
| 2021 | 23 | 5.4 | *— | *— | *— | *— | *— | Continued improvement |
| 2022 | 20 | 4.9 | *— | *— | *— | *— | *— | Steady progress |
| 2023 | 21 | 5.2 | *— | *— | *— | *— | *— | Normal variation |
| 2024 | 12 | 2.9 | *— | *— | *— | *— | *— | Historic low |
Racial breakdown not available for 2021-2024 single years
Racial Breakdown with Rates (per 1,000 live births):
| Period | Black Rate | White Rate | Hispanic Rate | Asian/PI Rate | Disparity Ratio | Key Context |
|---|---|---|---|---|---|---|
| 2019 | 18.0 | 1.9 | 3.1 | 0.0 | 9.47x | Crisis year |
| 2020 | 12.2 | 3.2 | 4.3 | 0.0 | 3.8x | Recovery begins |
| 2017-2021 | 10.9 | 2.9 | 4.9 | 3.2* | 3.76x | Pre-crisis baseline |
| 2018-2022 | 11.4 | 2.8 | 4.6 | 3.2* | 4.07x | Crisis impact beginning |
| 2019-2023 | 12.2 | 2.8 | 3.8 | 2.3* | 4.36x | Peak crisis effect |
| 2020-2024 | 9.8 | 2.6 | 4.0 | 1.5* | 3.77x | Sustained success |
Asterisks indicate rates based on small numbers (fewer than 10 deaths)*
Key Insights from Apples-to-Apples Comparison:
Crisis to Recovery (Single-Year Actual Data):
- 2019→2020 total deaths: 32 → 25 (22% reduction)
- 2019→2020 Black deaths: 24 → 15 (38% reduction)
- 2019→2020 disparity: 9.47x → 3.8x (60% improvement)
Approximate Annual Averages vs Single-Year Reality:
- 2017-2021 approximate annual: ≈25 deaths vs 2020 actual: 25 deaths
- 2020-2024 approximate annual: ≈20 deaths (showing sustained lower levels)
- Current success: ≈11 Black deaths annually vs 2019 crisis: 24 Black deaths
Multi-Year Trend Confirmation:
- Pre-crisis annual average: ≈14 Black deaths (2017-2021)
- Crisis impact visible: ≈14 Black deaths (2018-2022 and 2019-2023)
- Post-crisis success: ≈11 Black deaths annually (2020-2024)
Rate Improvements (Per 1,000 Live Births):
- Black families: 18.0 → 12.2 → stabilized at 9.8 (46% improvement)
- Overall community: 7.7 → 6.2 → stabilized at 4.9 (36% improvement)
- Disparity reduction: 9.47x → 3.8x → stabilized at 3.77x
Critical Findings:
- Immediate Impact: Single-year data shows Ten Steps worked immediately (2019→2020)
- Sustained Success: Approximate annual averages show continued improvement (≈20 total deaths vs 32 in crisis)
- Equity Achievement: Both absolute rates AND disparities improved significantly
- Community Benefit: All racial groups experiencing better outcomes
- Beyond Baseline: Current performance better than pre-crisis levels
Comparison to Historical Context:
- 2015-2019 pre-Ten Steps: Black 11.6, White 2.7, 4.30x disparity
- 2020-2024 post-Ten Steps: Black 9.8, White 2.6, 3.77x disparity
- Net achievement: 15% better Black rate, 12% better disparity than historical baseline
Data Sources:
- Single-year data: NC State Center for Health Statistics 2019 and 2020 reports
- Multi-year data: NC SCHS official reports 2021-2024 (5-year pooled totals)
- Approximate annual averages: Multi-year totals ÷ 5 (marked with ≈)
- All data represents North Carolina resident deaths by county of residence