Asian American, Native Hawaiian, and Pacific Islander Breastfeeding Week — August 15–21, 2026
Theme: Better Data, Better Care for AANHPI Families
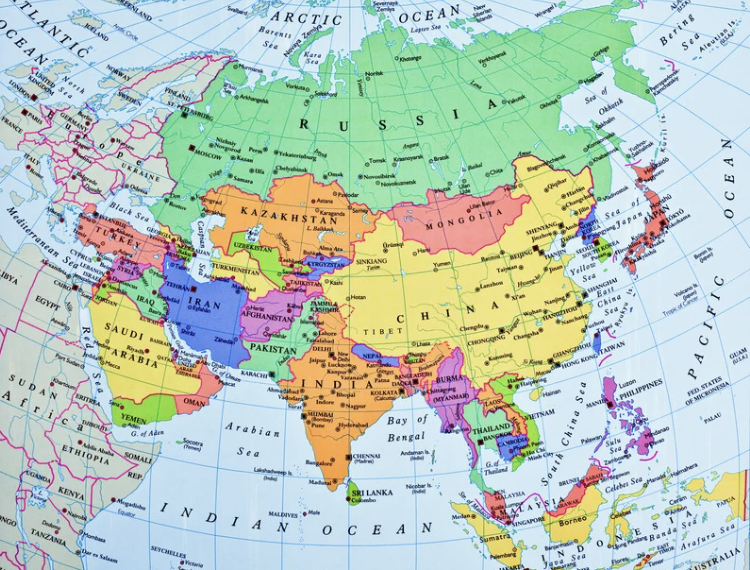
The acronym says Asian American, Native Hawaiian, and Pacific Islander. Geographically, that is an enormous part of the planet. Iran is in Asia. India is in Asia. Pakistan is in Asia. So are Samoa and Japan. But a map is not an identity. The question is whether the box matches how people understand themselves. If it does not, then every program built around that box is being designed for a population that may not exist in the way the data suggests. That is what makes this year’s theme, Better Data, Better Care for AANHPI Families, so important because a checkbox is never just a checkbox. It determines who gets counted. Who gets counted determines who gets seen and whose needs get addressed.
When the box does not fit
Consider Middle Eastern and North African communities.
For decades, there was no federal MENA category. Under the federal race and ethnicity standards established in 1997, MENA people were classified as White. That changed in March 2024, after decades of advocacy, when the Office of Management and Budget added Middle Eastern or North African as a federal reporting category. And even now, the change is not fully implemented. The federal compliance deadline is March 28, 2029. So in August 2026, much of the health data being collected still places MENA people in the White category. That matters because a disparity cannot be reliably measured if the population experiencing it is not visible in the data.
It also raises a broader question about identity. Is West Asia part of AANHPI? The answer is contested. The Census definition of Asian includes the Far East, Southeast Asia, and the Indian subcontinent, but not West Asia. Many organizations treat MENA and AANHPI as distinct populations.
The larger point is simple: people should not disappear because the available boxes do not fit.
What the AANHPI box hides in North Carolina
Now consider breastfeeding. In North Carolina, Asian families have the highest breastfeeding initiation rate of any racial group at 89.0%. Hispanic families are at 88.1%, White families at 84.6%, Native Hawaiian and Pacific Islander families at 82.7%, Black families at 70.8%, and American Indian and Alaska Native families at 52.1%. That 89% figure sounds like good news, but what happens when the box is opened?
In 2023, the CDC disaggregated breastfeeding data by subgroup:
| Group | Breastfeeding initiation |
|---|---|
| Japanese | 94.0% |
| Korean | 93.7% |
| Asian Indian | 93.4% |
| Filipino | 91.3% |
| Vietnamese | 89.3% |
| Chinese | 89.0% |
| Native Hawaiian | 84.3% |
| Guamanian or Chamorro | 83.5% |
| Samoan | 81.2% |
| Other Pacific Islander | 79.4% |
There is a 14.6-point difference between the highest and lowest rates.
The aggregate number hides that difference. That matters beyond breastfeeding because Native Hawaiian and Pacific Islander infants experience an infant mortality rate of 8.2 per 1,000 live births, compared with 3.4 among Asian infants. Two very different experiences can disappear inside one acronym.
North Carolina is still using the old box
North Carolina’s state health statistics still use a combined category: “Asian/Pacific Islander Non-Hispanic, single race, which was retired by the OMB in 1997. There is no published way to tell from that category whether an outcome belongs to Asian families or Pacific Islander families which matters because the combined data can look reassuring.
North Carolina’s combined category can therefore make important differences harder to see. In the state’s 2024 data, the Asian/Pacific Islander Non-Hispanic, single-race group had an infant mortality rate of 2.6 deaths per 1,000 live births, which may appear reassuring when viewed on its own. But that single number combines Asian and Pacific Islander infants, even though these populations can experience very different health outcomes. Without separate reporting, the state data cannot show whether the 2.6 rate reflects similar outcomes across both populations or whether a lower rate among Asian infants is masking higher mortality among Pacific Islander infants. The problem is not that the combined number is inaccurate and can hide the differences that policymakers and communities need to see.
Better data. Better care.
“Better Data, Better Care” is ultimately about making sure the families behind the numbers are visible. When broad categories combine populations with very different experiences, important disparities can disappear. Disaggregated data helps show where families are thriving, where they are being left behind, and where care needs to change. The goal is not to create more boxes for the sake of creating them. It is to make sure the categories we use reflect the people they are meant to represent—and that no family becomes invisible in the process. Better data should lead to better understanding, better decisions, and ultimately better care.
This August, as Asian American, Native Hawaiian, and Pacific Islander Breastfeeding Week is recognized, the question is simple: Are the boxes we use helping us see families clearly, or are they hiding the disparities that need our attention?